Cantilever beam uvl (solution)#
![]()
Deflection of a cantilever beam subjected to uniformly varying load#

Deflection at any point in \(x\) is given as: $\(y = \frac{w_0 x^2}{120l EI} \left(10l^3 -10l^2x + 5 lx^2 -x^3\right)\)$
The moment of inertia of a rectangular corss section of width (\(b\)) and depth (\(d\)) is:
\[I = \frac{bd^3}{12}\]
Plot the deflection of a 2m long cantilever beam subjected to a uniformly varying load of \(5 kN/m\). The beam has a stiffness of \(2*10^7 kPa\) and has a width of 0.4 m and a depth of 0.5 m.
import matplotlib.pyplot as plt
import numpy as np
# initial load (kN/m)
w0 = 5
# Length of cantilever beam (m)
l = 2
# Stiffness
E = 2E5
# width (b) is 0.4 m and depth (d) is 0.5m
b = 0.4
d = 0.5
# Moment of inertia
I = b*d**3/12
# Location for deflection
xlist = np.arange(0,1.01,0.01) * l
# Deflections
deflections = []
def_ratio = []
# Maximum deflection
def_max = -(w0 * l**4) / (30 * E * I) * 1e3
# Iterate through all possible locations
for x in xlist:
# Deflection
defl = -(w0 * x**2)/(120*l*E*I) * (10 * l**3 - 10 * l**2*x + 5 * l * x**2 - x**3) * 1000
deflections.append(defl)
def_ratio.append(defl/def_max)
#print(x, defl, defl / def_max)
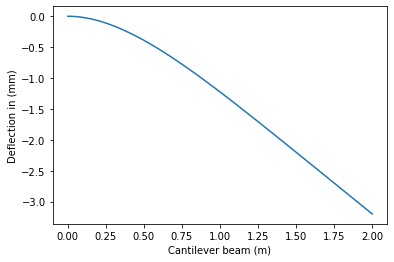
plt.xlabel("Cantilever beam (m)")
plt.ylabel("Deflection in (mm)")
plt.plot(xlist, deflections)
[<matplotlib.lines.Line2D at 0x7f142924cc50>]
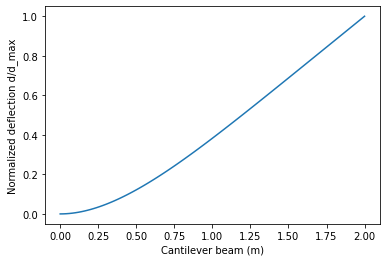
plt.xlabel("Cantilever beam (m)")
plt.ylabel("Normalized deflection d/d_max")
plt.plot(xlist, def_ratio)
[<matplotlib.lines.Line2D at 0x7f14290bfd30>]